

Opportunity zone fund fees shape the entire economics of an investment long before a project is stabilized or sold. In a structure built around tax deferral, a 2026 recognition date, and a 10-year hold for gain exclusion, the real question is not what the sponsor charges on page one of the deck, but what all layers of cost do to after-tax ROI over time.
Why Opportunity Zone Fund Fees Directly Impact After-Tax ROI
The strategic stake is simple: fee drag compounds, and Opportunity Zone investing is built for duration. A 1% or 2% annual charge looks manageable in year one. Over a decade, with project-level costs, reimbursable expenses, financing friction, and carried interest layered on top, that “small” fee can absorb a meaningful share of the tax benefit that attracted capital in the first place.
That point matters more in Opportunity Zone investing than in many other private placements because the timeline is locked into the tax rules. Eligible gain invested into a Qualified Opportunity Fund buys access to a federal incentive created by the Tax Cuts and Jobs Act of 2017. But access is not free. Capital is tied up. Reporting gets more technical. Real estate sponsors insert several compensation layers between capital raise and final sale. The result is a cost stack that is wider than the headline management fee and harder to compare across offerings.
Based on analysis of fund structures and actual private real estate practice, the recommendation is to underwrite Opportunity Zone funds as total economic systems, not tax wrappers. That means measuring after-tax ROI net of sponsor compensation, pass-through expenses, compliance costs, financing load, and illiquidity. It also means treating the 10-year hold not as a marketing feature, but as a force multiplier. Good execution compounds. So do bad fees.
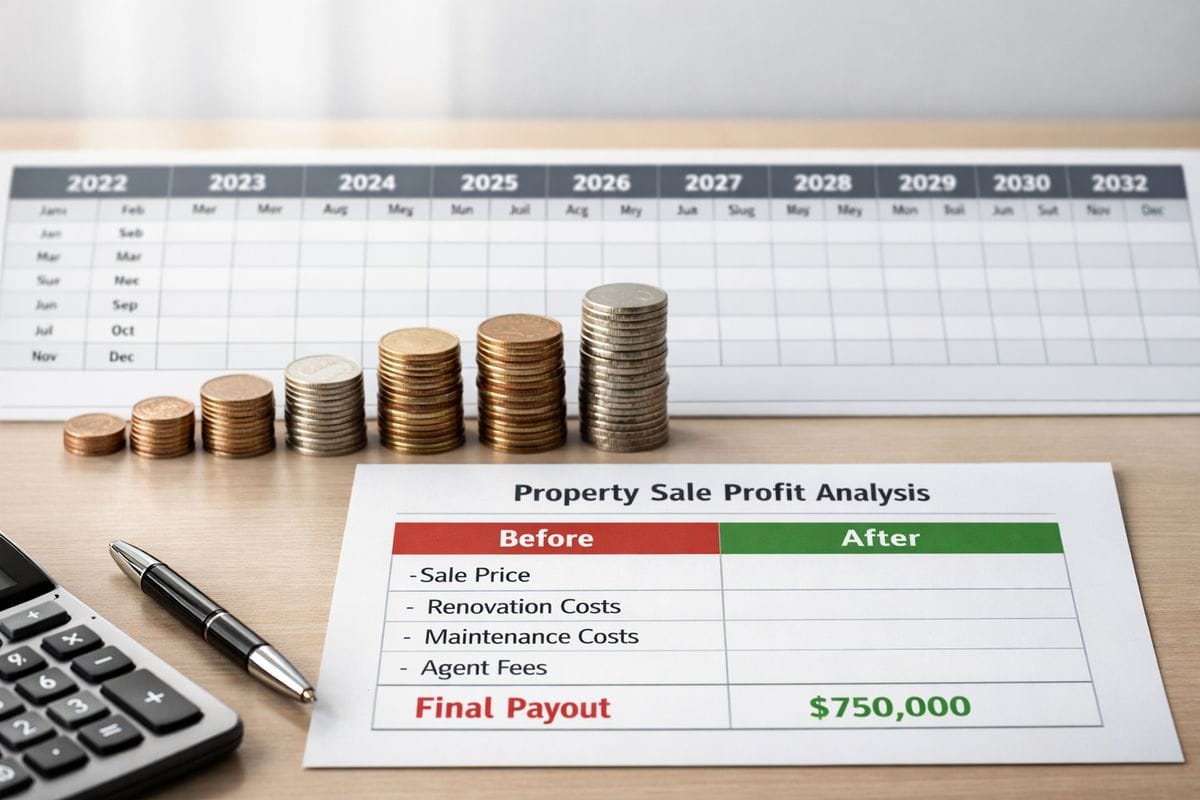
How Opportunity Zone Funds Work and Why the Structure Drives Fees
An Opportunity Zone investment starts with eligible capital gain. That gain must be invested within the applicable window into a Qualified Opportunity Fund, usually called a QOF. The QOF then deploys capital into qualified property or qualified businesses inside designated zones. Those zones cover 8,764 census tracts, roughly 12% of U.S. tracts across the United States and territories.
From there, the fee story begins.
A QOF is not just a legal shell. It is a tax-tested entity with asset thresholds, documentation requirements, often a multi-entity structure, and usually a real-estate-heavy operating model. Public research consistently shows capital has flowed overwhelmingly into real estate, construction, and lodging rather than operating businesses. One widely cited analysis found less than 3% of equity raised went into operating businesses, and federal analyses summarized by policy groups show about two-thirds of investee businesses were in real estate, construction, or lodging. That matters because real estate deals carry extra layers of fees by design: sourcing, acquisition, financing, development management, property management, leasing, refinance work, sale execution, and waterfall allocations.
In other words, the tax incentive does not sit on top of a simple investment fund. It usually sits on top of a private real estate capital stack. That structure is what drives fees.
The Core Tax Benefits Investors Are Paying to Access
The federal benefit package is clear in concept. Eligible gain can be deferred until December 31, 2026, or an earlier inclusion event. Early investors historically also had access to basis step-ups of 10% after five years and 15% after seven years, which mattered for pre-deadline capital placement. Most importantly, if the QOF interest is held for at least 10 years, post-investment appreciation can be excluded from federal capital gains tax, subject to the governing rules.
That benefit package is powerful, but it is not self-executing. You are paying fees to access, preserve, administer, and eventually monetize those tax outcomes. Any fee analysis that ignores the actual value of the tax benefits is incomplete. Any tax analysis that ignores the fee drag is equally flawed.
The recommendation is to put both into the same model. If the tax savings improve after-tax returns by 300 basis points, but total fee and expense drag consumes 250 basis points, the spread is too thin to justify weak execution or opaque economics. The tax incentive belongs in your underwriting, not in the sponsor’s compensation defense.
Why Real Estate-Dominant QOFs Usually Carry More Layers of Cost
The field data shows OZ capital has been concentrated in urban, real-estate-oriented projects. Research indicates 95% of investments had gone to urban zones as of 2020, and investment itself was heavily concentrated, with 1% of zones receiving 42% of total investment and 78% of investments going to just 5% of zones. That concentration is a clue about fee design. Sponsors have tended to chase larger, more financeable, development-driven projects, not simple stabilized assets.
Ground-up multifamily, hospitality, mixed-use redevelopment, and substantial-improvement projects all require more work and more intermediaries than a plain-vanilla fund buying liquid securities. Legal fees rise. Construction oversight rises. Lender fees appear. Interest carry becomes meaningful. Reporting becomes more detailed because lenders, tax counsel, accountants, and investors all need different information.
That added complexity can justify some cost. It does not justify vague cost.

The Five Drivers of What Investors Really Pay
Based on analysis of fund structures and field practice, total cost falls into five drivers: explicit fund fees, transaction costs, operating expenses, tax and compliance costs, and illiquidity or opportunity cost. This framework is the right way to compare one QOF to another because it captures both visible and hidden economics.
A fund with a 1% management fee and a broad reimbursement clause can be more expensive than a fund with a 2% management fee and tighter economics. A fund with moderate annual charges but an aggressive promote can be far more expensive at exit than the marketing deck suggests. A fund with modest explicit fees but poor liquidity terms can still destroy time-to-value.
Each driver matters. Combined, they determine what you really pay.
Driver 1: Sponsor Compensation and Headline Fund Fees
This is the layer investors usually see first. It includes annual management fees, acquisition fees, development or construction management fees, asset management fees, refinance fees, disposition fees, and the sponsor’s promote or carried interest. In many QOFs, several of these charges coexist.
Typical private real estate practice often places annual management around 1% to 2%, acquisition fees around 1% to 3%, disposition fees around 1% to 2%, and carried interest around 20% to 30% above a preferred return. That does not create a universal market schedule, because standardized public OZ fee reporting barely exists. It does show the range of normal private placement economics that often appears inside OZ offerings.
The problem is simple: the headline fee rarely captures full sponsor compensation. If a fund charges 1.5% management, 2% acquisition, 1% disposition, a development fee, and 20% carry, you are not paying 1.5%. You are paying a multi-stage compensation package.
Driver 2: Organizational and Offering Costs
The fund itself has to be created, documented, offered, administered, and reported. That means legal entity formation, private placement memorandum drafting, subscription documents, securities filings, accounting setup, tax return preparation, audits when required, investor K-1 reporting, and often third-party administration.
Some offerings absorb a portion of these costs at the sponsor level. Many pass them through directly or indirectly. In practice, that means your capital can be reduced before it ever reaches the property. Day-one deployable equity matters in OZ funds because a long hold magnifies every dollar lost upfront.
Driver 3: Property- and Project-Level Expenses
This is where investors often underestimate the cost stack. Property management, leasing commissions, lender legal bills, loan origination fees, lender reserves, appraisals, title, environmental reviews, insurance, brokerage, municipal approvals, construction oversight, and local operating expenses all sit below the fund. They are not “fund fees” in the narrow sense, but they reduce your return all the same.
In development-heavy OZ deals, this layer is often the largest source of economic leakage during the first several years. It also shapes timing risk. A project that absorbs more capital in pre-stabilization costs not only raises expense drag, it delays the cash generation needed to support the investment through 2026 and beyond.
Driver 4: OZ-Specific Tax and Compliance Burden
Opportunity Zone compliance is not generic fund administration. A QOF must monitor asset composition, working capital timing, entity structuring, annual testing, and the interaction between project operations and federal rules. The IRS Opportunity Zones guidance and related forms make clear that compliance is technical, recurring, and fact-dependent.
The 90% asset test, substantial improvement standard, and working capital safe harbor documentation all create recurring professional-fee pressure. Specialized tax counsel, accountants familiar with OZ rules, valuation support, and entity-level testing procedures all cost money. Funds that present the OZ structure as an ordinary real estate syndication with a tax bonus are usually understating this burden.
Driver 5: Illiquidity and Opportunity Cost
This is the hidden fee. You do not pay it to the sponsor. You pay it through lost flexibility.
An OZ strategy is built around a tax event in 2026 and a 10-year hold for exclusion of future gains. That structure reduces optionality before and after the deferred gain becomes taxable. There is limited secondary market liquidity for QOF interests. Transfer restrictions are common. A weak project can trap capital in a vehicle that no longer compares favorably with other available uses of funds.
Opportunity cost is not abstract. It is the foregone ability to rotate into higher-yield assets, reduce debt, fund better acquisitions, or use alternative tax strategies with clearer pricing. In long-duration private investments, that cost can exceed the explicit fee line items.

The Fee Vocabulary in Opportunity Zone Offerings
Fee terms in offering decks often sound familiar while hiding materially different economics. Decoding that vocabulary is one of the highest-ROI parts of due diligence because a single phrase in a PPM can shift thousands of dollars from investors to the sponsor over a decade.
Management Fee vs. Asset Management Fee
These terms are often treated as interchangeable. They should not be.
A management fee can be charged at the fund level on committed capital, invested capital, net asset value, or capital contributions. An asset management fee often sits at the property or project entity level and is paid for ongoing oversight of operations, financing, reporting, or execution. If both exist, you are paying two layers of “management” compensation.
The base matters just as much as the percentage. A 1.5% fee on committed capital for years before full deployment is more expensive than a 1.5% fee on invested capital after deployment. A fee charged on cost basis rather than net value also changes economics over time. The recommendation is to ask exactly what base applies in each year of the hold.
Acquisition, Development, and Construction Fees
These charges compensate the sponsor or affiliates for sourcing deals, negotiating purchases, managing entitlements, overseeing design, and running construction execution. In a real-estate-focused QOF, this is normal. The problem starts when multiple fees cover the same function.
For example, an acquisition fee, development fee, and construction management fee can all be legitimate if the scope is distinct and the amounts are reasonable. The red flag appears when the same sponsor earns compensation at each stage without a clear division of work or when affiliates mark up services that could be outsourced competitively.
These fees also hit early, which means they reduce the amount of capital working for you during the years when compounding should be starting.
Promote, Carried Interest, and Distribution Waterfalls
The promote is where sponsor economics often become most expensive. A carried interest gives the sponsor a share of profits above a defined hurdle. That hurdle is usually called a preferred return. Waterfalls then determine who gets what and when.
A healthy structure usually requires return of invested capital and a meaningful preferred return before the sponsor shares heavily in upside. A weak structure allows the sponsor to participate too early, often through low hurdles or catch-up mechanics.
Catch-up provisions deserve close attention. After the preferred return is met, a catch-up tier can route most or all distributions to the sponsor until a target split is reached. That can sharply shift economics even when the stated carry percentage looks ordinary. If you see 20% carry with a full catch-up, underwrite the actual distribution path, not the label.
Expense Reimbursement Clauses
This is where the biggest disclosure gap often sits. Broad reimbursement language can cover legal fees, travel, third-party consultants, overhead allocations, broken-deal costs, diligence expenses, internal staff support, compliance work, and affiliate services.
Uncapped reimbursements transfer cost uncertainty from the sponsor to you. Even if the amounts stay reasonable, the underwriting becomes less reliable because expenses can expand without changing the visible fee schedule.
The recommendation is to treat reimbursement language as a primary economic term, not fine print. If it is broad, uncapped, and poorly defined, you do not have fee transparency.
What a Typical Opportunity Zone Cost Stack Looks Like in Practice
There is no standardized public fee dataset for Opportunity Zone funds comparable to regulated mutual fund disclosures. Public research documents the tax framework, investment concentration, and policy effects far better than actual sponsor fee schedules. That absence is itself one of the core buyer risks.
Still, common private real estate practice provides a useful way to model what a full cost stack often looks like in plain English. The goal is not to invent a universal market schedule. The goal is to show where returns are actually consumed.
Upfront Costs in Year 1
Year one often includes organizational expenses, offering document costs, placement or capital raise expenses, acquisition fees, due diligence, legal setup, lender origination charges, third-party reports, title and recording, appraisal, and early-stage project launch costs.
The practical result is that $100,000 invested rarely becomes $100,000 of productive project equity on day one. A portion pays for the machine that got the fund formed and the deal closed. In development deals, more capital then gets absorbed by pre-construction and early execution costs before the asset produces durable cash flow.
That early reduction in deployable capital matters because you still own the tax timeline. Time starts running on the investment, but the project often takes years to reach stabilized economics.
Annual Ongoing Costs During the Hold
During the hold, recurring charges usually include fund management, asset management, administration, audit, tax prep, investor reporting, property management, insurance, financing costs, reserve requirements, leasing, maintenance, local taxes, and ongoing OZ testing or legal review.
This is where long duration changes the math. On a $100,000 investment, a 2% annual management fee alone can consume roughly $18,000 over 10 years before any carried interest is paid, assuming the fee is charged consistently and ignoring compounding on foregone growth. Add a separate asset management fee, fund administration, and property-level friction, and the gap between gross and net returns grows quickly.
Exit-Stage Costs
Sale-stage costs often include brokerage, legal, transfer taxes, debt unwind expenses, disposition fees, final compliance work, and the promote. In successful deals, the promote can become the largest single sponsor payday because it captures upside after years of execution.
That is not inherently bad. Sponsors should be rewarded for creating value. But sale-stage economics are exactly where modest-looking annual fees can be overshadowed by waterfall design. If the promote structure is aggressive, a large share of exit value shifts away from you at the point where the OZ exclusion is supposed to shine.

Why Limited Transparency Is One of the Biggest Costs
One of the most important findings in this market is not a published average fee. It is the lack of standardized fee disclosure.
Mutual funds and many public vehicles operate inside clear disclosure templates. Opportunity Zone funds do not. Fee schedules, affiliate arrangements, reimbursement rights, and waterfall mechanics are disclosed in private documents with widely varying levels of clarity. That increases due diligence time, pricing uncertainty, and execution risk. Those are real costs, even if no invoice arrives.
What Public Data Shows and What It Does Not
Public data strongly documents the basic structure and policy effects of the program. IRS guidance explains tax mechanics, QOF qualification, and investor timing. Research groups document where capital has flowed, who has benefited, and how concentrated the program has been. For example, public analysis shows only 48% of designated zones received any investment between 2018 and 2020, and high-income participation has been pronounced, with one Urban Institute-style analysis citing average annual investor income around about $4.9 million.
What public data does not show well is standardized sponsor compensation across funds. There is little consistent reporting on actual fee schedules, project-level pass-through expense load, or how much broad reimbursement language translates into realized costs over time. That gap forces investors to build their own comparison framework.
How Opaque Fees Distort Return Comparisons
A return comparison is only useful when all options are shown on a comparable net basis. That often fails in practice.
An OZ fund may advertise a management fee while leaving project-level expenses, reimbursement clauses, and promote mechanics to the PPM. A Delaware Statutory Trust may show placement and sponsor economics differently. A 1031 exchange often pushes costs into intermediary fees, transactional friction, and property-level operations. A REIT discloses expenses through a different reporting standard altogether.
If one option shows only a 1.5% management fee and another shows total load, the lower-fee impression is meaningless. The recommendation is to normalize every strategy into total economic burden and expected net performance.
The Three Principles for Evaluating Opportunity Zone Fund Fees
Based on analysis of fund economics, the recommendation is to evaluate OZ fees using three principles: measure total load, match fees to execution value, and underwrite net returns without giving the sponsor free credit for your tax benefit.
These principles cut through most marketing noise.
Principle 1: Measure Total Load, Not the Headline Fee
Start by aggregating every explicit and implicit cost you can identify. That includes annual management, asset management, acquisition, development, disposition, administration, audit, tax prep, property-level expenses, debt costs, reimbursement rights, and waterfall economics.
Then convert those into investor-level dollars. A percentage by itself hides the practical effect. On $100,000 over 10 years, even “ordinary” private fund fees become meaningful. The table below gives a buyer’s-guide benchmark using common private real estate practice, not a universal market rule.
| Fee element | Typical QOZ fund | Standard real estate syndication | Public REIT | Approx. dollar impact on $100K over 10 years |
|---|---|---|---|---|
| Management fee | 1% to 2% annually | 1% to 2% annually | Embedded operating expense ratio, often lower and disclosed differently | QOZ: about $10,000 to $18,000 at 1% to 2%; Syndication: similar; REIT: structure-specific, usually lower direct drag |
| Acquisition fee | 1% to 3% upfront | 1% to 2% upfront | None at investor level | QOZ: $1,000 to $3,000; Syndication: $1,000 to $2,000; REIT: $0 direct |
| Disposition fee | 1% to 2% at sale | 1% to 2% at sale | None at investor level | QOZ: depends on sale proceeds, often $1,000 to $2,000+ on original capital equivalent; Syndication: similar; REIT: $0 direct |
| Carried interest / promote | 20% to 30% above hurdle | 20% to 30% above hurdle | None in partnership waterfall form | Highly variable, often the largest upside transfer at exit |
| Preferred return hurdle | Commonly 6% to 8%, but not universal | Commonly 6% to 8% | Not applicable in the same way | Lower hurdle means earlier sponsor participation |
That table is a comparison tool, not a pricing rule. REIT costs are usually embedded in reported operating expense ratios and public-company overhead rather than charged as acquisition and disposition fees to each investor. QOZ funds and private syndications rely far more on direct deal-stage and waterfall compensation.
The red flags are decisive: more than three sponsor fee layers before the promote, no preferred return hurdle before carried interest, and catch-up provisions that shift economics heavily toward the GP.
Principle 2: Match Fees to Complexity and Execution Value
Higher fees are justified only when complexity is real and execution value is documented. Ground-up development in an Opportunity Zone with difficult entitlements, tax structuring, construction management, and lease-up risk is not the same as buying a stabilized property with minimal operational complexity.
In this kind of program, the right question is not “Is 2% too high?” The right question is “What outcome does that fee buy?” If the sponsor has a strong local record, disciplined debt execution, credible construction oversight, and clean OZ compliance systems, a premium can improve net ROI by reducing delays, overruns, or compliance failures.
But the reverse is also true. Paying development-level fees for ordinary acquisition-level work is pure value transfer.
Principle 3: Underwrite Net Returns Without Full Tax Credit for the Sponsor
The tax incentive belongs in your model. It does not belong in the sponsor’s fee excuse.
A sponsor often markets the OZ structure as if the tax benefit offsets mediocre economics. That is the wrong standard. Underwrite the deal net of all fees and assume the asset still has to perform on rents, occupancy, NOI growth, financing terms, and exit value. Then layer the tax benefit on top as incremental value.
If the investment only works because the tax exclusion rescues weak property economics, the recommendation is to pass.
How Fees Interact With the Tax Benefits
The OZ tax benefit can improve after-tax returns. It does not neutralize bad fee design or weak real estate execution. This is where many buyers get distracted, because the tax headline is emotionally powerful while fee drag is cumulative and less visible.
The 2026 Deferral Deadline Changes the Math
Deferred gain becomes taxable by the end of 2026 unless an earlier inclusion event occurs. That timing matters because an investor can owe tax before the fund has distributed meaningful cash, especially in development-heavy strategies.
This is one of the most underappreciated cash planning issues in the structure. The tax bill is real even if the project is still in lease-up or reserve-building mode. If the fund is not expected to distribute enough to cover that liability, your after-tax ROI drops further because outside capital has to cover the tax.
A 10-Year Hold Magnifies Compounding Fee Drag
Every recurring charge matters more over 10 years than over three. A 1.5% annual fee does not just reduce current yield. It reduces the capital base that can compound into the tax-free appreciation period. Add property-level leakage, and the cumulative effect becomes material.
This is why fee comparison in OZ funds is not a cosmetic exercise. There is often no practical early exit to escape a high-fee structure without damaging the intended tax outcome. Once invested, fee drag becomes part of the asset’s long-term performance DNA.
Tax-Free Exit Gains Do Not Rescue a Bad Deal
The strongest marketing line in OZ investing is the potential exclusion of future QOF gains after a 10-year hold. The catch is obvious once the numbers are laid out: tax-free gain only helps if gain exists after all fees, expenses, debt service, and promote allocations.
A weak project with slow rent growth, poor cost control, expensive financing, and aggressive waterfall terms can still underperform badly on a net basis. In that situation, the tax exclusion is attached to a disappointing outcome.
Opportunity Cost: The Hidden Fee Most Investors Underestimate
The data shows that long lockups and limited liquidity are central economic costs in OZ investing. This is not secondary. It is one of the primary costs.
Capital Lockup and Reduced Portfolio Flexibility
A long hold blocks redeployment. Capital that could be used to reduce floating-rate debt, fund a higher-yield acquisition, capitalize value-add improvements in owned properties, or execute a different tax strategy remains trapped in the QOF.
That lost flexibility has a measurable business cost. In periods of rising rates, distressed pricing, or strong alternative opportunities, the inability to reposition capital lowers portfolio efficiency and delays better ROI.
Concentration Risk in a Narrow Geography or Single Project
Many OZ funds are not diversified portfolios. They are one development, one sponsor, one geography, sometimes one submarket within one urban tract. Public research on OZ investment concentration reinforces the point that capital has clustered heavily rather than dispersing evenly across zones.
Concentration increases the cost of being wrong. If a single project underperforms, there is no portfolio diversification inside the vehicle to offset it. That makes fee discipline even more important because there are fewer ways for the structure to recover.
Timing Risk Around Development and Lease-Up
Construction delays, supply-chain friction, higher interest carry, slower lease-up, and refinancing stress all increase the effective cost of capital. None of those risks require the disclosed management fee to change. But your economic burden still rises because time extends while capital stays tied up.
In practice, timing risk often behaves like an undisclosed fee. It consumes return without appearing on the schedule.

How Opportunity Zone Fund Fees Compare With Other Real Estate Tax Strategies
A useful buyer’s guide does not look at OZ funds in isolation. Real estate investors often weigh them against 1031 exchanges, Delaware Statutory Trusts, direct ownership, and standard syndications. Each structure prices costs differently.
Opportunity Zone Funds vs. 1031 Exchanges
A 1031 exchange keeps capital inside replacement real estate and defers gain through like-kind exchange rules rather than a QOF wrapper. Costs usually show up as intermediary fees, legal work, title and escrow, debt placement, and ordinary property operations, not as a layered fund compensation model.
That often makes fee visibility better at the transaction level, though not always lower in total. The main difference is control and structure. In a 1031, you are usually underwriting identified replacement property rather than outsourcing execution to a sponsor-managed fund. Timelines are tighter, but economics are often easier to map.
OZ funds, by contrast, package tax strategy and delegated execution together. You gain passivity. You pay for it.
Opportunity Zone Funds vs. Delaware Statutory Trusts and TIC Structures
DSTs and TICs are also passive ownership vehicles used by real estate investors seeking tax-planning outcomes, especially in replacement-property contexts. Sponsor economics exist there too, often through upfront load, asset management, financing spreads, and sale-stage economics.
The difference is that OZ funds add a specific federal tax compliance layer and usually longer-duration business plans linked to development or substantial improvement. That can make the fee stack more complex and the cash flow profile more back-ended.
Opportunity Zone Funds vs. Direct Real Estate Ownership
Direct ownership strips out sponsor carry and some fund-level overhead. In exchange, you keep execution responsibility. For experienced landlords and operators, that trade-off can be attractive because every outsourced function has a price.
But direct ownership also requires time, local knowledge, deal sourcing, financing management, and operational discipline. If those capabilities are weak, paying a sponsor with a genuine record can produce better net results despite the extra fees. The recommendation is to compare what the sponsor does against what your own platform can do at lower cost and equal quality.
Opportunity Zone Funds vs. Standard Private Real Estate Syndications
Many fee components in OZ funds are not truly OZ-specific. Acquisition fees, asset management fees, and promotes are common across standard syndications. What is OZ-specific is the added compliance burden, the tax-driven holding framework, and the reduced flexibility around timing.
That distinction matters because some sponsors present ordinary syndication economics as if the OZ label justifies premium pricing. It does not. Only actual incremental complexity justifies incremental fees.
Red Flags That Signal an Overpriced Opportunity Zone Fund
Overpriced OZ funds tend to reveal themselves through structure long before performance proves the point. The following signals deserve immediate scrutiny.
Multiple Fees for the Same Function
If the sponsor earns sourcing, acquisition, development, construction management, and asset management fees without a clear division of labor, economics are likely inflated. More than three sponsor fee layers before the promote is a serious warning sign.
The problem is not that each label is illegitimate. The problem is overlap. If one team controls the transaction end to end, a stack of separate charges often means the same work is being monetized multiple times.
Broad Expense Reimbursement With No Caps
Uncapped reimbursement language creates open-ended return leakage. Legal, travel, consulting, diligence, overhead allocations, affiliate support, and broken-deal expenses can all be shifted to investors if the clause is broad enough.
The recommendation is simple: if reimbursements are uncapped and undefined, pricing is incomplete.
Waterfalls That Shift Too Much Upside to the Sponsor Too Early
No preferred return hurdle before carried interest is a hard red flag. So is an aggressive catch-up clause that diverts distributions to the sponsor immediately after a low hurdle is met.
Waterfall design should reward performance after investors recover capital and a meaningful risk-adjusted return. If the sponsor gets rich before you are properly compensated for duration, illiquidity, and project risk, the structure is misaligned.
Weak Reporting and No Net-of-Fee Performance Presentation
Gross IRR marketing is not enough. A credible OZ fund should present projected net returns, fee impacts, assumptions, and downside scenarios. If performance materials avoid net-of-fee modeling, the sponsor is asking you to underwrite in the dark.
Questions to Ask Before Investing in an Opportunity Zone Fund
A buyer’s guide is only useful if it converts into due diligence action. Use the following question sets to force clarity before capital is committed.
Fee Disclosure Questions
Ask for a complete schedule of direct fees, indirect fees, reimbursable expenses, affiliate compensation, and waterfall allocations. Request a sample $100,000 investment illustration showing all fees over the life of the deal, including assumptions for management, acquisition, disposition, and carried interest. Ask whether any asset management fee exists separate from the fund management fee.
Tax and Compliance Questions
Ask who is responsible for QOF testing, what counsel or CPA team handles OZ compliance, how the 90% asset test is monitored, how working capital safe harbor documentation is maintained, and what remediation process applies if a compliance failure occurs. Ask directly who bears the cost of remediation.
Project Execution Questions
Ask about sponsor track record in similar developments, budget contingency, debt structure, maturity schedule, lease-up assumptions, refinancing triggers, and how delays change fee timing and investor distributions. Ask whether development or construction fees continue during delays.
Liquidity and Exit Questions
Ask about transfer restrictions, sale timing, extension rights, refinance assumptions, interim liquidity mechanisms, and how the sponsor handles the 2026 tax recognition event in relation to projected cash distributions. If there is no practical liquidity path, the economics should compensate you for that fact.
When Higher Fees Are Worth Paying
Higher fees are worth paying only when they produce better net outcomes. That standard is strict and measurable.
Specialized Development and Compliance Capability
Complex ground-up projects in Opportunity Zones demand tax structuring, construction management, entitlement execution, lender coordination, and local operating skill. If the sponsor has a documented record in the exact asset type and market, additional compensation can be justified because execution quality drives ROI.
The proof has to be operational, not promotional. You should see prior projects, realized timelines, actual lease-up outcomes, and evidence of disciplined compliance processes.
Institutional Reporting and Governance
Stronger administration, third-party audit, independent valuation support, and clear investor reporting also justify added cost. Better governance lowers operational risk, reduces surprise expenses, and improves decision quality over a long hold.
In a 10-year vehicle, governance is not a cosmetic feature. It is part of return preservation.
When the Recommendation Is to Walk Away
An OZ tax incentive does not fix weak economics. Some combinations of fees, opacity, and execution risk are simply unattractive.
The Tax Story Dominates the Underwriting
If the sponsor spends more time selling the tax benefit than explaining NOI growth, lease-up assumptions, debt terms, local demand, construction budget discipline, and exit valuation, the deal is mispriced. Tax benefits enhance a good investment. They do not create one from bad fundamentals.
The Underlying Asset Would Not Qualify as a Good Investment Without OZ Treatment
This is the decisive screen. Remove the OZ benefit and examine the property economics. If the asset fails on location quality, demand drivers, replacement-cost logic, rent assumptions, capital structure, or sponsor execution record, reject it.
That recommendation is direct because the tax-free exit only applies to value that is actually created.
Who Opportunity Zone Funds Fit Best, and Who Pays Too Much for Them
Opportunity Zone funds are not broad-market solutions. Fit depends on the size of your capital gain, your time horizon, your tolerance for illiquidity, and your comfort underwriting private real estate risk.
Best Fit: Investors With Large Capital Gains, Long Time Horizons, and Tolerance for Illiquidity
The structure fits best when you have significant eligible gains, can fund the 2026 tax liability from other sources if needed, and can hold for 10 years without forcing a liquidity event. It also fits when you understand private real estate economics well enough to evaluate sponsor execution instead of buying the tax story alone.
That profile aligns with public research showing OZ users skew heavily affluent, with analysis citing average annual incomes around $4.9 million among participating investors.
Poor Fit: Investors Seeking Current Income, Flexibility, or Simple Fee Structures
If your priority is current cash flow, transparent pricing, short hold periods, or the ability to rebalance quickly, OZ funds are usually an expensive fit. The fee stack is too layered, the liquidity is too limited, and the payoff timeline is too long.
The same is true if your portfolio already carries concentrated real estate exposure in a single market or strategy. Adding a long-duration, sponsor-controlled OZ vehicle often raises concentration without adding enough incremental advantage.
The Recommendation: Underwrite Opportunity Zone Funds on Total Economic Cost, Not Tax Marketing
Based on analysis of OZ fund economics, the recommendation is clear: approve only funds that disclose full sponsor compensation, define reimbursable expenses tightly, present net-of-fee return scenarios, and remain attractive even before generous tax assumptions are added. Measure the total load, stress the 2026 cash obligation, and reject any structure that relies on tax excitement to hide weak property underwriting or aggressive sponsor economics.
A good Opportunity Zone investment earns the tax benefit. It does not ask you to ignore the price of getting there.
Frequently Asked Questions
What is a normal management fee for an Opportunity Zone fund?
Common private real estate practice often places annual management fees around 1% to 2%, but that number is only a starting point. A QOF can also charge acquisition, asset management, development, disposition, and carried interest. Total economic burden matters more than any single annual fee.
Are Opportunity Zone fund fees higher than standard real estate syndication fees?
Often, yes, because a QOF can add OZ-specific tax and compliance costs on top of ordinary syndication economics. The gap is largest in development-heavy structures with multiple entities, recurring testing, and layered affiliate compensation.
What is the biggest hidden fee in an Opportunity Zone fund?
Illiquidity is the biggest hidden fee. Capital is tied up in a long-duration structure with limited transfer options, reduced flexibility before and after the 2026 tax recognition date, and meaningful exposure to project delays. Broad expense reimbursement clauses are the biggest hidden explicit cost.
Is carried interest in an OZ fund a red flag?
No. Carried interest is common and can align incentives when the structure includes a meaningful preferred return and investor-first waterfall. It becomes a red flag when there is no preferred return, when catch-up provisions are aggressive, or when recurring fees are already excessive.
How should a $100,000 OZ investment be modeled for fees?
Model every fee in dollars, not just percentages. Include annual management, asset management if any, acquisition fee, disposition fee, reimbursable expenses, property-level expenses, financing costs, and a sample promote calculation at exit. On a $100,000 investment, a 2% annual management fee alone can consume roughly $18,000 over 10 years before carry.
Do tax benefits make high fees acceptable?
No. Tax benefits improve after-tax returns only if the underlying project creates value after all fees, expenses, and waterfall allocations. A tax incentive does not justify weak fundamentals, vague disclosure, or inflated sponsor compensation.
References
- cbcny.org
- cbh.com
- irs.gov
- itep.org
- opportunityzones.com
- proskauertaxtalks.com